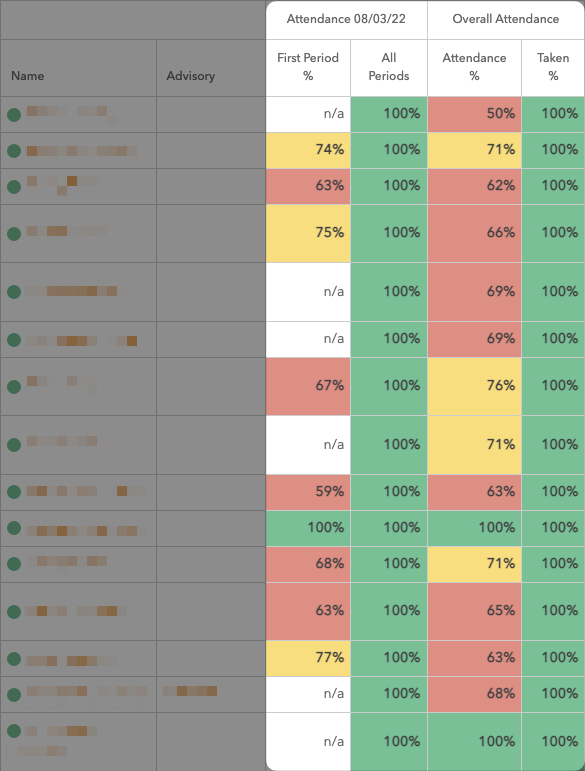
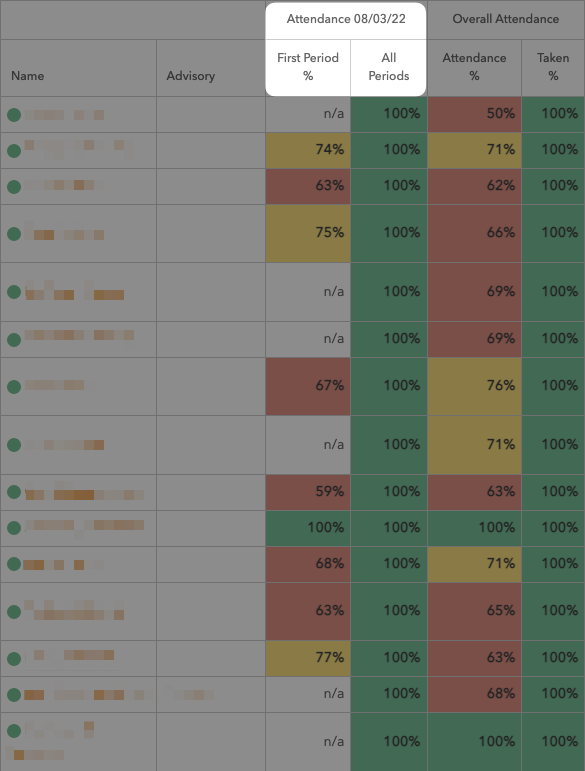
The staff dashboard has four columns that display attendance data. Two columns are grouped under the "Attendance Today" heading, and the other two are grouped under the "Attendance Period" heading.
It's important to be aware of the "From" and "To" dates selected, as these dates determine which attendance data is displayed on the dashboard. Be sure that the "To" date is a school day, or you won't see any data under the "Attendance Today" columns.
It's also important to realize that "Attendance Period" refers to the range of dates in the "From" and "To" fields, whereas the "Period" in "First Period %" and "All Periods" refers to class periods in a single school day.

Attendance Today
The two columns under this header show you attendance data for a single day only. That date is determined by the "To" field. Note that if a non-school day is in the "To" field, you can expect to see "n/a" for all teachers. You can also expect to see "n/a" in the "First Period %" column if a teacher doesn't have a first period class for the date selected in the "To" field. A teacher with no courses at all will be indicated with "n/a" in the "All Periods" column as well.
When data is displayed in the "First Period %" column, you'll be looking at the percentage of students present in that teacher's first period class. If you hover over the percentage in this column, you can even see the exact numbers behind the percentage (8 out of 8 students present, for example, or 25 out of 28 students present).
When data is displayed in the "All Periods" column, you'll be looking at the percentage of classes assigned to a teacher that s/he has taken attendance in. In other words, if a teacher has five classes today, yet has only logged attendance in one, you'll see 20% displayed. A 100% indicates that that particular teacher has logged class attendance for each of his/her assigned classes. Note that it's normal for this percentage to increase throughout the day as more classes meet and attendance is logged for those classes. You can also hover over this percentage to get more details on which classes have had attendance taken and which classes have not.
Note: for clients that we sync with via Clever, or who use our School Setup feature, the "First Period" column represents the attendance percentage in first class in which attendance was taken, which is not necessarily period 1. For example, if a math teacher doesn't take attendance in her period 1 class but does take attendance in her period 2 class, the "First Period" column will show the percentage of students present in her period 2 class since that was the first class in which she took attendance.
For clients that send their data to us directly from PowerSchool, "First Period" is the chronologically-earliest (as in time of day) period that is flagged to count for daily attendance.
Attendance Period
The two columns under this heading show attendance data for the full time period selected in the "From" and "To" fields. Note that this data may the same as that in the "Attendance Today" section if the date range is just one single day. You can expect to see "n/a" here if a teacher doesn't have courses assigned to him/her in the time period selected.

The data in the "Attendance %" column represents the overall student attendance percentage for the time period chosen, based on all the times that that teacher logged class attendance (i.e. 96% of Mr. Greene's students showed up for classes that he took attendance for in this time period).
The data in the "Taken %" column reflects the overall percentage of classes for which a given teacher has taken attendance (i.e. out of 100 classes in this time period, Ms. Sanchez took attendance in 19 of them, giving her 19% ). Note that you will see 0% in every cell here if you send us your data via Clever.
Configuring Dashboard Color Thresholds
See this article to learn more about configuring dashboard colors and thresholds.
Comments
0 comments
Please sign in to leave a comment.